Supervised Learning with SCI-KIT
Most of things you need to cover in supervised learning. (Theoretically + Programitaclly)
Machine Learning Key Concepts
Machine learning is the process whereby computers learn to make decisions from data without being explicitly programmed.
- Supervised learning is a machine learning approach where the model is trained on labeled data. The training data includes input-output pairs, where the output serves as a guide for the model to learn and make predictions. This approach is commonly used for tasks such as classification and regression.
- Unsupervised learning deals with unlabeled data, meaning the model has no predefined output labels. Instead, it aims to uncover hidden patterns, relationships, or structures within the data. Common applications of unsupervised learning include clustering, dimensionality reduction, and anomaly detection.
- Reinforcement learning is where agent learns to make decisions by interacting with an environment. The agent receives feedback in the form of rewards or penalties based on the actions it takes, which helps it learn the optimal strategy or policy for achieving its goals.
Two Categories of Supervised learning
- Classification is a way of predicting discrete outcomes or categories, such as determining whether an email is spam or not.
- Regression is a way of predicting continuous numeric values, such as estimating the price of a house based on its features.
Classification
Classification can be divide into two main categories
- Binary classification is where outcome is only has two outcomes. for example spam or not. either it can be a spam or not a spam. only two outcomes.
- Multiclass classification is where outcome has many outcomes. for example rate 1 to 10 it can be 1 , 4 , 5 or any other between 10.
SCIKIT-Learn Syntax
The below code is only provided to help you understand the syntax. It is not a working code. As you can see, you need to import a model from the sklearn library, fit it with your labeled data, add the data you want to predict, and then display the predictions. It’s very straightforward. All you need to do is find the appropriate model for your specific task. Additionally, you should evaluate the accuracy of the model and understand the concepts of underfitting and overfitting, which will be covered at the end of this blog.
SCIKIT-learn Syntax
# Import Model from sklearn.module (In your case it find the right model)
# for example you can use Kneighbour_classifier model from sklearn.neighbour
from sklearn.module import Model
# Initialize model using Model
model = Model()
# Using fit method providing by sklearn.module Model() fit labeled data
# X represent features (prediction variable) inputs
# y represent target (dependent varible) outcome
model.fit(X,y)
# Xnew represent records needed to predict
Xnew = [[1,2],
    [4,12]]
# Using label data it found in the fit method. model will predict output for X_new inputs
model.predict(X_new)
Using KNeighboursClassifier
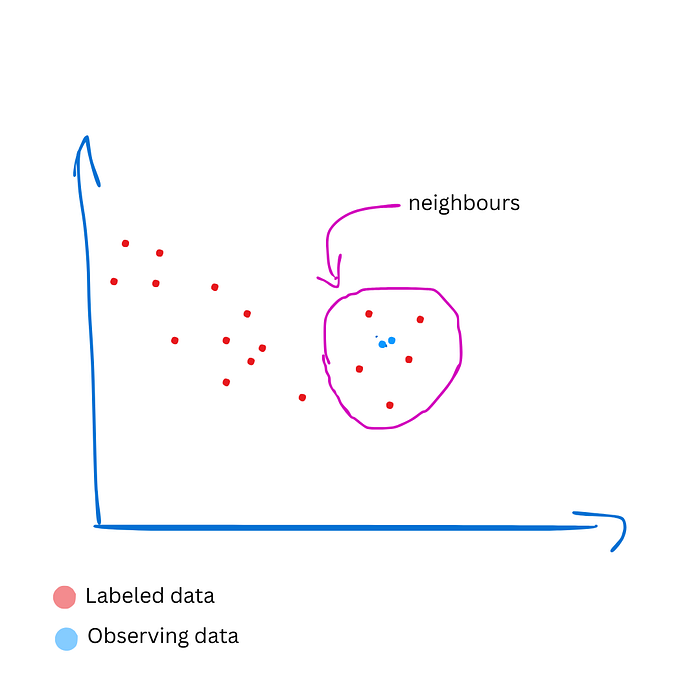
k-Nearest Neighbors algorithm is a algorithm which is using neighbour labeled data to predict outcome of the observing unlabeled data.
# Import KNeighborsClassifier model
from sklearn.neighbors import KNeighborsClassifier

# Replace this with actual DataFrame creation or import
import pandas as pd
import numpy as np

# Example DataFrame
# account_length = 10 ; customer service calls = 1 ; churn = 0 ;
# As you seen churn is the dependent varible (outcome)
data = {
    "account_length": [10, 20, 30, 40, 50, 60],
    "customer_service_calls": [1, 2, 3, 4, 5, 6],
    "churn": [0, 1, 0, 1, 0, 1]  # 0: No churn, 1: Churn
}
churn_df = pd.DataFrame(data)

# Define the target and features
y = churn_df["churn"].values
X = churn_df[["account_length", "customer_service_calls"]].values

# Create a KNN classifier with 6 neighbors
knn = KNeighborsClassifier(n_neighbors=6)

# Fit the classifier to the data
knn.fit(X, y)

# Observing data (data that needs to predict)
X_new = np.array([[12, 40], [1, 5]])

# Predict the labels for the X_new
y_pred = knn.predict(X_new)

# Print the predictions
print("Predictions: {}".format(y_pred))
Measuring model performance
In machine learning accuracy is a very important factor that we cannot ignore.
When we are going to check model accuracy First, we should split data set into two different data sets. Training data and Test Data. Then we fit Training data set into the model and calculate accuracy using test data sets.
complexity
The parameter k in the KNN algorithm determines the number of nearest neighbors used to classify a data point. It significantly affects the complexity and accuracy of the model.
Lower K will lead model into Underfitting and Higher K will lead model into overfitting
Undefitting- model is too simple to capture the underlying patterns in the data. Perform badly on training data and even worse on test data.
Overfitting — model is too complex and starts to memorize the training data. Perform well in training data but fails on test data.
Plotting accuracy check complexity
# Import required modules
from sklearn.model_selection import train_test_split
from sklearn.neighbors import KNeighborsClassifier
import numpy as np
import matplotlib.pyplot as plt

# Separate features (X) and target (y)
X = churn_df.drop("churn", axis=1).values  # Drop the target column 'churn' and keep only features
y = churn_df["churn"].values  # Target variable

# Split the data into training and test sets
# test_size=0.2 means 20% of the data is for testing, and 80% is for training
# random_state ensures reproducibility of the split
# stratify=y ensures the split maintains the same proportion of target labels in both sets
X_train, X_test, y_train, y_test = train_test_split(X, y, test_size=0.2, random_state=42, stratify=y)

# Instantiate the KNN classifier with 5 neighbors
knn = KNeighborsClassifier(n_neighbors=5)

# Fit the KNN model to the training data
knn.fit(X_train, y_train)

# Calculate and print the accuracy of the model on the test data
# This evaluates the proportion of correct predictions on the test set
print(f"Test Accuracy with k=5: {knn.score(X_test, y_test)}")

# Create an array of neighbor values to test (1 through 12)
neighbors = np.arange(1, 13)  # Neighbor values from 1 to 12
train_accuracies = {}  # Dictionary to store training accuracies
test_accuracies = {}  # Dictionary to store testing accuracies

# Loop through each value of neighbors
for neighbor in neighbors:
    # Instantiate a KNN model with the current number of neighbors
    knn = KNeighborsClassifier(n_neighbors=neighbor)

    # Fit the KNN model to the training data
    knn.fit(X_train, y_train)

    # Calculate and store the accuracy on the training data
    train_accuracies[neighbor] = knn.score(X_train, y_train)

    # Calculate and store the accuracy on the test data
    test_accuracies[neighbor] = knn.score(X_test, y_test)

# Print neighbors and corresponding accuracies for verification
print("Neighbors:", neighbors)
print("Training Accuracies:", train_accuracies)
print("Testing Accuracies:", test_accuracies)

# Add a title to the plot
plt.title("KNN: Varying Number of Neighbors")

# Plot training accuracies
plt.plot(list(train_accuracies.keys()), list(train_accuracies.values()), label="Training Accuracy", marker='o')

# Plot test accuracies
plt.plot(list(test_accuracies.keys()), list(test_accuracies.values()), label="Testing Accuracy", marker='o')

# Add legend to differentiate between training and testing accuracy
plt.legend()

# Add labels to the axes
plt.xlabel("Number of Neighbors")
plt.ylabel("Accuracy")

# Display the plot
plt.show()